Calculating and Graphing Speed - The Tortoise and the Hare TEKS 6.8C 6.8D
Endless Science
62 Followers
Grade Levels
6th - 8th
Subjects
Resource Type
Formats Included
- Word Document File
Pages
2 pages
Endless Science
62 Followers
What educators are saying
My students loved this resource, they were engaged in the resource and it was easy to implement in my classroom.
I USED THIS WHEN I HAD TO HAVE A SUB IN THE ROOM AND THE STUDENTS WERE ALL ABLE TO COMPLETE IT WITHOUT NEEDING ANY EXTRA HELP
Description
Need help connecting calculating speed to motion graphs?
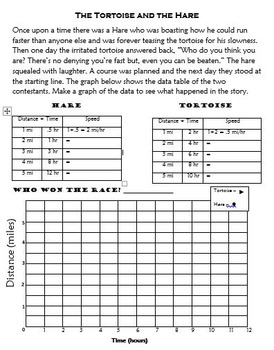
I use this worksheet to reinforce what my students know about motion graphs and have them connect that to speed calculations. We walk through this together. I have them graph the Hare first and have them tell me what they know about his speed based on what we graphed. Then we calculate his speed and compare it to what was predicted. I do the same with the Tortoise. The we compare which parts of the graph indicate a change in speed and finally what the tortoise's Constant Speed looks like. It's nice practice for them. Short, sweet and effective.
I use this worksheet to reinforce what my students know about motion graphs and have them connect that to speed calculations. We walk through this together. I have them graph the Hare first and have them tell me what they know about his speed based on what we graphed. Then we calculate his speed and compare it to what was predicted. I do the same with the Tortoise. The we compare which parts of the graph indicate a change in speed and finally what the tortoise's Constant Speed looks like. It's nice practice for them. Short, sweet and effective.
Total Pages
2 pages
Answer Key
Not Included
Teaching Duration
30 minutes
Report this resource to TPT
Reported resources will be reviewed by our team. Report this resource to let us know if this resource violates TPT’s content guidelines.


