TPT
Total:
$0.00

Bundle - 3rd Grade Common Core Math & ELA Standards Tracker

Rated 5 out of 5, based on 1 reviews
5.0Β (1 rating)
;
AJR Resources
10 Followers
Grade Levels
3rd
Standards
Formats Included
  • Google Sheetsβ„’
$14.40
List Price:
$16.00
You Save:
$1.60
Bundle
$14.40
List Price:
$16.00
You Save:
$1.60
Bundle
Share this resource
Report this resource to TPT
AJR Resources
10 Followers
Includes Google Appsβ„’
This bundle contains one or more resources with Google apps (e.g. docs, slides, etc.).

What educators are saying

This has been a time saver instead of making my own. I love how the last sheet shows students individual scores. Easy to keep track of all standards.

Products in this Bundle (2)

    Description

    **This is a bundle deal for both of my Common Core Data Trackers for math and ELA (RL/RI) for 3rd grade.**

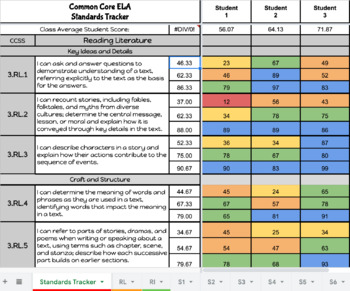
    These data trackers have all of the CCSS third grade math and ELA (RL/RI) standards listed with opportunities for your students to have three attempts for scores to be entered to show mastery or proficiency for each standard. You do not have to use all three attempts, but we all know that sometimes we need a little more work to reach our end goal. This is also great to record pre-test and post-test scores on with a third option for those that still need intervention to reach mastery or become proficient. There is a main page for you to enter your data on and individual tabs for each math strand that the data will populate to for you to make it easier to view as an option.

    Once you have entered the student data on the main page, it will automatically generate to their own student tabs. This is a great feature for one on one meetings with students, meetings with parents or administration, easy to print for evidence of effort and growth for MTSS, RTI, or any other sources you may need student data for. The student page has their scores and it uses those scores to create a bar graph for each standard and attempt to visually show the students their growth or progression. This is a fantastic feature if you are having students track their own data and want an easy way to show them a model that their graph could/should look like.

    As you enter student scores on the main page, the scores will also color code themselves to help you easily see where your students are on that standard at a glance. This can also help you create groups for remediation, enrichment, group work, etc. The color coded scale is as follows:

    Red: 0 to 19

    Yellow: 20 to 39

    Orange: 40 to 59

    Green: 60 to 79

    Blue: 80 to 100

    This is geared towards third grade, but if you are tech savvy with Google Sheets, you are able to tweak this to meet your needs for other grade levels with math or ELA (RL/RI).

    This is also available for fourth and fifth grade!

    Bundle: 4th Grade Common Core Math & ELA Standards Tracker

    Bundle: 5th Grade Common Core Math & ELA Standards Tracker

    Total Pages
    Answer Key
    N/A
    Teaching Duration
    N/A
    Report this resource to TPT
    Reported resources will be reviewed by our team. Report this resource to let us know if this resource violates TPT’s content guidelines.

    Standards

    to see state-specific standards (only available in the US).
    Tell and write time to the nearest minute and measure time intervals in minutes. Solve word problems involving addition and subtraction of time intervals in minutes, e.g., by representing the problem on a number line diagram.
    Measure and estimate liquid volumes and masses of objects using standard units of grams (g), kilograms (kg), and liters (l). Add, subtract, multiply, or divide to solve one-step word problems involving masses or volumes that are given in the same units, e.g., by using drawings (such as a beaker with a measurement scale) to represent the problem.
    Draw a scaled picture graph and a scaled bar graph to represent a data set with several categories. Solve one- and two-step β€œhow many more” and β€œhow many less” problems using information presented in scaled bar graphs. For example, draw a bar graph in which each square in the bar graph might represent 5 pets.
    Generate measurement data by measuring lengths using rulers marked with halves and fourths of an inch. Show the data by making a line plot, where the horizontal scale is marked off in appropriate units-whole numbers, halves, or quarters.
    Recognize area as an attribute of plane figures and understand concepts of area measurement.

    Reviews

    Questions & Answers

    10 Followers