TPT
Total:
$0.00

Bundle: 17 Primary/Elementary Math Anchor Charts/Poster

;
Miss Mia's Classroom
4 Followers
Grade Levels
K - 10th
Subjects
Resource Type
Standards
Formats Included
  • Zip
$24.95
$24.95
Share this resource
Report this resource to TPT
Miss Mia's Classroom
4 Followers

Description

Would you like to decorate your classroom with fun, hand-drawn anchor charts/posters? Do you simply not have the time to get them done? Well, you have come to the perfect place! I love making these engaging and appealing anchor charts. I also can draw/create any other topic you would like, just contact me directly and ask! My students absolutely love these posters and references them every day. Many of them are visual learners, so the colorful images really help them connect and remember what they have learned.

**This purchase will include a ZIP drive including 17 PDFs

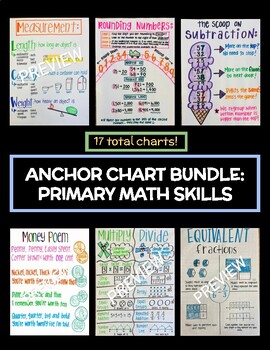
**This particular deal is a bundle of 17 different primary math anchor charts including the following topics:

*Measurement

*Rounding

*Subtraction

*Money

*Multiplying vs. Dividing

*Equivalent Fractions

*Multiplication Strategies

*Graphing

*Word Problems

*Time

*Quadrilaterals

*Comparing Numbers

*Linus the Minus

*Gus the Plus

*Addition

*2-D Shapes

*3-D Shapes

**This purchase is for one customer's use only. Please do not share with others and should be for personal classroom use only. This cannot be used in other creations for commercial or sale use.

Hope you love it! :)

Total Pages
Answer Key
N/A
Teaching Duration
N/A
Report this resource to TPT
Reported resources will be reviewed by our team. Report this resource to let us know if this resource violates TPT’s content guidelines.

Standards

to see state-specific standards (only available in the US).
Describe measurable attributes of objects, such as length or weight. Describe several measurable attributes of a single object.
Directly compare two objects with a measurable attribute in common, to see which object has “more of”/“less of” the attribute, and describe the difference. For example, directly compare the heights of two children and describe one child as taller/shorter.
Order three objects by length; compare the lengths of two objects indirectly by using a third object.
Generate measurement data by measuring lengths of several objects to the nearest whole unit, or by making repeated measurements of the same object. Show the measurements by making a line plot, where the horizontal scale is marked off in whole-number units.
Draw a scaled picture graph and a scaled bar graph to represent a data set with several categories. Solve one- and two-step “how many more” and “how many less” problems using information presented in scaled bar graphs. For example, draw a bar graph in which each square in the bar graph might represent 5 pets.

Reviews

Questions & Answers