TPT
Total:
$0.00

Budget Portfolio - Percents, Fractions, and Decimals

;
Rebecca Holt
3 Followers
Grade Levels
6th - 7th
Standards
Formats Included
  • Google Slides™
Pages
22 pages
FREE
FREE
Share this resource
Report this resource to TPT
Rebecca Holt
3 Followers
Made for Google Drive™
This resource can be used by students on Google Drive or Google Classroom. To access this resource, you’ll need to allow TPT to add it to your Google Drive. See our FAQ and Privacy Policy for more information.

Description

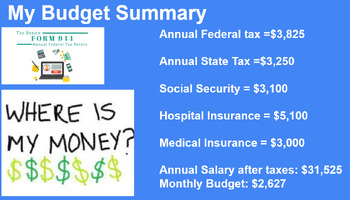
Step into the world of practical math with my meticulously crafted 'First Job Budget Portfolio Project' designed for 6th and 7th-grade classrooms. This engaging project seamlessly weaves percents, fractions, and decimals into the fabric of real-world decision-making. Students assume the role of a 22-year-old recent college graduate, celebrating their first job and embarking on the journey of creating a monthly budget based on their first annual salary. Aligned with specific 6th and 7th-grade Common Core Standards for Mathematics, this project not only facilitates a deep understanding of mathematical concepts but also cultivates critical research and digital presentation skills. With guided links, Google Slides templates, and an exemplar for reference, students navigate the intricacies of budgeting, ensuring their numbers are approved before finalizing their finished product. Elevate your math curriculum with a project that not only meets academic standards but empowers students with the essential life skills needed for financial success in the real world!

Total Pages
22 pages
Answer Key
N/A
Teaching Duration
2 Weeks
Report this resource to TPT
Reported resources will be reviewed by our team. Report this resource to let us know if this resource violates TPT’s content guidelines.

Standards

to see state-specific standards (only available in the US).
Understand that statistics can be used to gain information about a population by examining a sample of the population; generalizations about a population from a sample are valid only if the sample is representative of that population. Understand that random sampling tends to produce representative samples and support valid inferences.
Interpret and compute quotients of fractions, and solve word problems involving division of fractions by fractions, e.g., by using visual fraction models and equations to represent the problem. For example, create a story context for (2/3) ÷ (3/4) and use a visual fraction model to show the quotient; use the relationship between multiplication and division to explain that (2/3) ÷ (3/4) = 8/9 because 3/4 of 8/9 is 2/3. (In general, (𝘢/𝘣) ÷ (𝘤/𝘥) = 𝘢𝘥/𝘣𝘤.) How much chocolate will each person get if 3 people share 1/2 lb of chocolate equally? How many 3/4-cup servings are in 2/3 of a cup of yogurt? How wide is a rectangular strip of land with length 3/4 mi and area 1/2 square mi?
Fluently divide multi-digit numbers using the standard algorithm.
Fluently add, subtract, multiply, and divide multi-digit decimals using the standard algorithm for each operation.
Find the greatest common factor of two whole numbers less than or equal to 100 and the least common multiple of two whole numbers less than or equal to 12. Use the distributive property to express a sum of two whole numbers 1–100 with a common factor as a multiple of a sum of two whole numbers with no common factor. For example, express 36 + 8 as 4 (9 + 2).

Reviews

Questions & Answers

3 Followers