TPT
Total:
$0.00

Big Bend Math: Graphing, Converting time, D=Rt, Unit Rate & Coordinate Graph

;
Math Through the Parks
21 Followers
Grade Levels
6th - 8th
Resource Type
Standards
Formats Included
  • PDF
Pages
17 pages
$4.00
List Price:
$5.00
You Save:
$1.00
$4.00
List Price:
$5.00
You Save:
$1.00
Share this resource
Report this resource to TPT
Math Through the Parks
21 Followers

Description

Hiking Big Bend

This activity incorporates the following skills:

· Converting minutes to hours and hours to minutes

· Unit rate

· Graphing and Interpreting

· Unit Rate

· D=RT

· Real world application

· Proportional Reasoning

Calculating Distance

Based on teacher preference you can answer for answers in hours and minutes or just minutes. The answer sheet includes both answers. Also, you can access the actual Big Bend map on the NPS website.

This activity incorporates the following skills:

· Converting minutes to hours and hours to minutes

· Unit rate

· Graphing and Interpreting

· Unit Rate

· D=RT

· Real world application

· Proportional Reasoning

· Geography

Coordinate Graphing

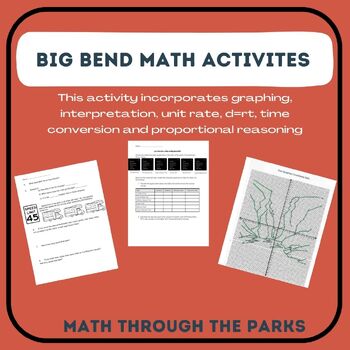
I included two types of graphs. One that has each line is equal to one and one that each line equal to 2. I personally like the coordinate grid that counts by two because I feel like it is easier to see the picture, but the other graph may be easier to plot points for some students.

Total Pages
17 pages
Answer Key
Included
Teaching Duration
2 hours
Report this resource to TPT
Reported resources will be reviewed by our team. Report this resource to let us know if this resource violates TPT’s content guidelines.

Standards

to see state-specific standards (only available in the US).
Display numerical data in plots on a number line, including dot plots, histograms, and box plots.
Reporting the number of observations.
Describing the nature of the attribute under investigation, including how it was measured and its units of measurement.
Relating the choice of measures of center and variability to the shape of the data distribution and the context in which the data were gathered.
Understand that statistics can be used to gain information about a population by examining a sample of the population; generalizations about a population from a sample are valid only if the sample is representative of that population. Understand that random sampling tends to produce representative samples and support valid inferences.

Reviews

Questions & Answers