Bar Graph Smartboard Center Activity
Bethany Agostinelli
2 Followers
Resource Type
Standards
CCSS1.MD.C.4
Formats Included
- NOTEBOOK (SMARTboard) File
Pages
3 pages
Bethany Agostinelli
2 Followers
Description
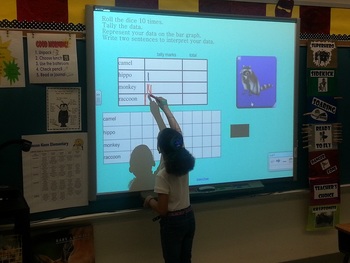
These interactive slides are designed to effectively integrate technology into your classroom and provide students with an independent or collaborative math center activity creating bar graphs.
They will organize/collect data by rolling the picture dice.
They will represent their data by filling in a bar graph.
They will interpret their data by writing 2 sentences comparing the information on the bar graph.
Students love this bar graphing center!
They will organize/collect data by rolling the picture dice.
They will represent their data by filling in a bar graph.
They will interpret their data by writing 2 sentences comparing the information on the bar graph.
Students love this bar graphing center!
Total Pages
3 pages
Answer Key
N/A
Teaching Duration
N/A
Report this resource to TPT
Reported resources will be reviewed by our team. Report this resource to let us know if this resource violates TPT’s content guidelines.
Standards
to see state-specific standards (only available in the US).
CCSS1.MD.C.4
Organize, represent, and interpret data with up to three categories; ask and answer questions about the total number of data points, how many in each category, and how many more or less are in one category than in another.


