Attendance Graphs (for absences and tardies)
Vance Sims
56 Followers
Description
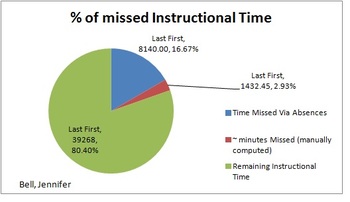
The Excel file will, in tandem from your Student Information System, will graph the minutes of instruction that a student has missed up to the date you you choose (we try to use it quarterly). If you have an electronic method of tracking tardies, you can add that data too and the graph will discriminate between minutes/% missed by each. The sheet is set up to graph up to 50 students on this page. The instructions for use on on the second worksheet of the workbook. For absences, your SIS should give you all of the data easily. The tardies is a bit more work but worth it for those with tardy issues.
Attendance Graphs for School by Vance Sims is licensed under a Creative Commons Attribution 3.0 Unported License
Total Pages
2 pages
Answer Key
N/A
Teaching Duration
N/A
Report this resource to TPT
Reported resources will be reviewed by our team. Report this resource to let us know if this resource violates TPT’s content guidelines.


