TPT
Total:
$0.00

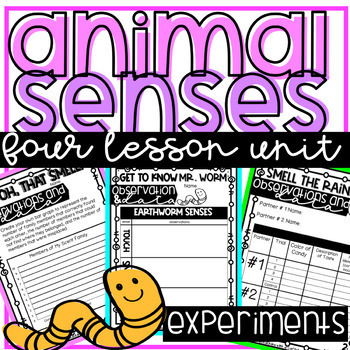
Animal and Human Senses Unit using the 5 Senses with Engaging Experiments

Rated 4.57 out of 5, based on 14 reviews
4.6 (14 ratings)
;
Teaching with a Caffeine Queen
3.6k Followers
Grade Levels
3rd - 5th
Resource Type
Standards
Formats Included
  • PDF
Pages
42 pages
$4.00
$4.00
Share this resource
Report this resource to TPT
Teaching with a Caffeine Queen
3.6k Followers

What educators are saying

This resource was great! Thank you so much!! My students really enjoyed the different smells and trying to find their homes. It was fun watching them smell the scents for the first time!

Description

Just like humans, animals rely on their senses for survival. With this activity, your students will be exploring the different ways that animals use their senses to help interpret the world around them and, ultimately, survive!

Your students will be completing hands on science experiments to help them better understand the importance of senses and the role they play in many animals' survival.

This product includes:

  • 4 Engaging and Hands on Lessons
  • 15 Pages of Lesson Plans and Teacher Tips
  • Student Workbook Pages - to invoke deep discussion and observation

These experiments are for PERSONAL USE ONLY! Please read terms when purchasing item for more information.

___________________________________________________________________

I hope you and your class love it as much as mine does!

  • To see my products in action - check out my Instagram!

Please contact me with any questions!

Check out my other STEM Products!

You can also find me on:

Instagram

My Blog

YouTube

Facebook

Pinterest

Thank you,

©Teaching with a Caffeine Queen

Total Pages
42 pages
Answer Key
N/A
Teaching Duration
N/A
Report this resource to TPT
Reported resources will be reviewed by our team. Report this resource to let us know if this resource violates TPT’s content guidelines.

Standards

to see state-specific standards (only available in the US).
Draw a scaled picture graph and a scaled bar graph to represent a data set with several categories. Solve one- and two-step “how many more” and “how many less” problems using information presented in scaled bar graphs. For example, draw a bar graph in which each square in the bar graph might represent 5 pets.
Generate measurement data by measuring lengths using rulers marked with halves and fourths of an inch. Show the data by making a line plot, where the horizontal scale is marked off in appropriate units-whole numbers, halves, or quarters.
Make a line plot to display a data set of measurements in fractions of a unit (1/2, 1/4, 1/8). Solve problems involving addition and subtraction of fractions by using information presented in line plots. For example, from a line plot find and interpret the difference in length between the longest and shortest specimens in an insect collection.
Understand a fraction 1/𝘣 as the quantity formed by 1 part when a whole is partitioned into 𝘣 equal parts; understand a fraction 𝘢/𝑏 as the quantity formed by 𝘢 parts of size 1/𝘣.
Add and subtract mixed numbers with like denominators, e.g., by replacing each mixed number with an equivalent fraction, and/or by using properties of operations and the relationship between addition and subtraction.

Reviews

Questions & Answers