Anchor Charts: Everything Graphing! 14 in All! - Pie, Line, Picto & Bar Graphs,
- PDF
Also included in
- These Anchor Charts Based on the entire Data Management and Probability Unit can be displayed in the classroom or via the SmartBoard. 26 ANCHOR CHARTS! This resource is aligned with the 2005 Ontario Math Curriculum Document: Data Management & Probability - Grades 3, 4, 5, & 6.What's IncludedPrice $6.99Original Price $8.97Save $1.98
- This Mega 100+ Anchor Chart Bundle is all you will need for the entire school year! These Anchor Charts can be displayed in the classroom via the SmartBoard or Virtually. Perfect for Distance Learning. Refreshed to include Resources for the New 2020 Ontario Math Curriculum: Number, Algebra, Data,Price $24.50Original Price $42.87Save $18.37
- 4 Bar Graph Games!-Online Digital Bar Graphs Game-Online Digital Bar Graphs Game (Body Movement Version) -Downloadable Bar Graphs Board Game -Downloadable Bar Graphs Board Game (Body Movement Version) +Bonus 14 Graphing Anchor Charts!IntroductionCreating a SurveyExamples of Survey QuestionsTally ChPrice $7.50Original Price $14.50Save $7.00
- Dr. SillyPants has you covered! Everything you will need to teach Data Analysis and Graphing. Covers most of the 2020 Ontario Data Literacy: Data Analysis & Probability Strand. (Junior Grades). Perfect for both In-Class and Distance Learning. Students will have a blast learning about Mean, MePrice $22.99Original Price $42.97Save $19.98
- This Super Mega 130+ Anchor Chart Bundle is all you will need for the entire school year! These Anchor Charts can be displayed via the Smartboard or Computer Screen, Printed for display around the classroom or given to students for personal reference.Covers the expectations for the 2020 Ontario MatPrice $45.00Original Price $71.81Save $26.81
- Teaching Probability & Data Literacy? Dr. SillyPants has you covered. Everything you will need to teach the entire Data Math Strand Probability & Data Analysis (Graphing) Junior Grades) 18 Resources! Perfect for both In-Class and Distance Learning. Students will have a blast learning abouPrice $45.99Original Price $76.92Save $30.93
Description
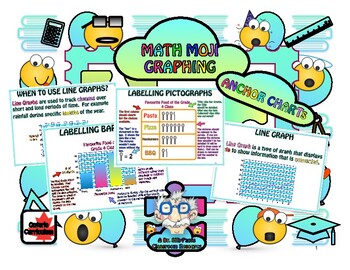
Anchor Charts Based on Different Types of Graphs (Data Management) to be displayed in the classroom. Can also be displayed via SmartBoard.
Included - 14 Anchor Charts:
Introduction
Creating a Survey
Examples of Survey Questions
Tally Chart
Different Types of Graphs
Line Graphs
When to use Line Graphs
Labelling Line Graphs
Bar Graphs
Labelling Bar Graphs
Pictographs
Labelling Pictographs
Pie Graphs
Labelling Pie Graphs
This resource is aligned with the 2005 Ontario Math Curriculum Document - Grades 3, 4, 5 & 6: Data Management & Probability.
A Dr. SillyPants Classroom Resource. Can be paired with Math Moji Fractions Games!
Do you have a subject or topic that you would like to have turned into an interactive game? Please message us and we will make it happen! Reviews are always welcome!
Did You Find an Error?
We know that errors can happen. If you find an error, rather than leaving negative feedback, please let me know via the "Ask a Question" tab and I will fix the error as fast as possible.


