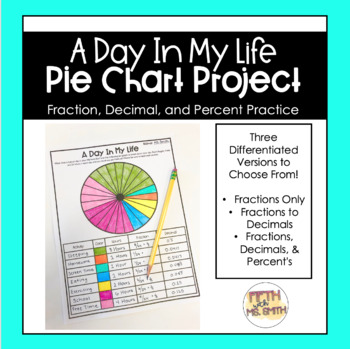
A Day In My Life Pie Chart- Decimals, Fractions, and Percent Conversion Practice
Fifth With Ms Smith
381 Followers
What educators are saying
This resource was a lot of fun. My class enjoyed doing this activity! It made learning fun. I will continue to use it.
I used this in math intervention. The next time I use it, I will already have certain categories filled in such as sleeping, eating, school, playing, reading. It was a struggle for students to independently complete. This is a great resource.
Description
Are you looking for a fun and engaging way to teach your students conversions? Look no further! This product can be easily differentiated to fit your classroom needs.
What it includes:
- Option 1: Students create a pie graph of their day in fractions.
- Option 2: Students create a pie graph of their day in fractions and decimals.
- Option 3: Students create a pie graph of their day in fractions, decimals, and percents.
Total Pages
3 pages
Answer Key
N/A
Teaching Duration
N/A
Report this resource to TPT
Reported resources will be reviewed by our team. Report this resource to let us know if this resource violates TPT’s content guidelines.


