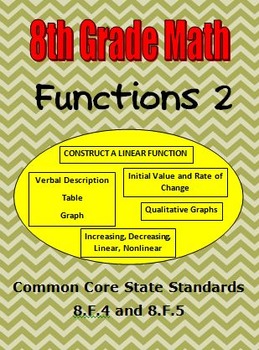
8th Grade Math - Functions (2) - Construct, Interpret, Describe - CCSS 8.F.4-5
Hilda Ratliff
1.6k Followers
Resource Type
Standards
CCSS8.F.B.4
CCSS8.F.B.5
Formats Included
- PDF
Pages
53 pages
Hilda Ratliff
1.6k Followers
Description
This product will save you time as the guided notes and examples are ready for you to copy and give your students. These activities were created as teacher led lessons in which students stay engaged as they complete the notes and examples in the activities listed below. Independent practice is included in each activity.
Included in this resource:
1. Construct a function to model a linear relationship given in different representations by finding the rate of change and initial value. 10 student pages
2. Interpret the rate of change (slope) and initial value (y-intercept) of functions in different representations according to the situation the function models. 8 student pages
3. Analyze and construct qualitative graphs by describing where the function is increasing, decreasing, linear or nonlinear. Compare different parts of the graph to tell which part has the greatest rate of change. 7 student pages
4. Many Guided Examples
5. Detailed Answer Keys
6. Lots of Independent Practice
Click on a topic for additional 8th grade resources.
8th Grade Math - Functions - Rate of Change, Initial Value - CCSS 8.F.1,2,3
8th Grade Math Compare Functions - Two Matching Games - CCSS 8.F.2
Common Core Math 8th grade (8.EE1,2) Activities Plus I Have - Who Has Game
Math Activities 8th Grade - Proportions, Slope, y=mx+b - CCSS 8.EE.5,6
Math 8th Grade Solve Equations with the Variable on Both Sides - CCSS 8.EE.7
Math Board Games Bundle - 8th Grade (8.NS, 8.EE, 8.F, 8.G, 8.SP)
Thanks for viewing!
Created by Hilda Ratliff
Total Pages
53 pages
Answer Key
Included
Teaching Duration
N/A
Report this resource to TPT
Reported resources will be reviewed by our team. Report this resource to let us know if this resource violates TPT’s content guidelines.
Standards
to see state-specific standards (only available in the US).
CCSS8.F.B.4
Construct a function to model a linear relationship between two quantities. Determine the rate of change and initial value of the function from a description of a relationship or from two (𝘹, 𝘺) values, including reading these from a table or from a graph. Interpret the rate of change and initial value of a linear function in terms of the situation it models, and in terms of its graph or a table of values.
CCSS8.F.B.5
Describe qualitatively the functional relationship between two quantities by analyzing a graph (e.g., where the function is increasing or decreasing, linear or nonlinear). Sketch a graph that exhibits the qualitative features of a function that has been described verbally.


