
6th Grade Statistics Project Box Plot Mean Median Mode Range Histogram Activity


- Zip
What educators are saying
Also included in
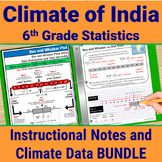 Enrich your study of India using 6th Grade stats skills to analyze India climate data. Master Data Display with Box and Whisker Plots, Histograms, Dot Plots, Stem and Leaf Charts. Calculate Measures of Central Tendency (mean, median, mode, range) and Mean Absolute Deviation. Write Statistical QuestiPrice $12.92Original Price $16.15Save $3.23
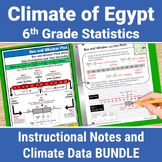 Enrich your study of Ancient Egypt using 6th Grade stats skills to analyze Egypt climate data. Master Data Display with Box and Whisker Plots Activity, Histograms, Dot Plots, Stem and Leaf Charts. Calculate Measures of Central Tendency (mean, median, mode, range) and Mean Absolute Deviation. Write SPrice $12.92Original Price $16.15Save $3.23
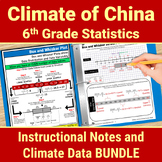 Enrich your study of Ancient China using 6th Grade stats skills to analyze China climate data. Master Data Display with Box and Whisker Plots, Histograms, Dot Plots, Stem and Leaf Charts. Calculate Measures of Central Tendency (mean, median, mode, range) and Mean Absolute Deviation. Write StatisticaPrice $12.92Original Price $16.15Save $3.23
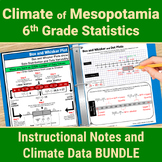 Enrich your study of Mesopotamia using 6th Grade stats skills to analyze Mesopotamian climate data. Master Data Display with Box and Whisker Plots, Histograms, Dot Plots, Stem and Leaf Charts. Calculate Measures of Central Tendency (mean, median, mode, range) and Mean Absolute Deviation. Write StatiPrice $12.92Original Price $16.15Save $3.23
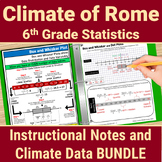 Enrich your study of Ancient Rome using 6th Grade Statistics and Probability skills to analyze Italy climate data. Master Data Display with Box and Whisker Plots, Histograms, Dot Plots, Stem and Leaf Charts. Calculate Measures of Central Tendency (mean, median, mode, range) and Mean Absolute DeviatiPrice $13.80Original Price $16.15Save $2.35
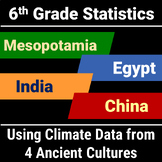 Enrich your geography study of ancient cultures using 6th Grade Statistics and Probability skills to analyze climate data. Calculate Measures of Central Tendency (mean, median, mode, range) and Mean Absolute Deviation. Master Box and Whisker Plots, Histograms, Dot Plots, Stem and Leaf Charts. WritePrice $24.32Original Price $30.40Save $6.08
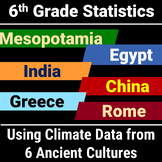 Enrich your study of ancient cultures using 6th Grade Statistics and Probability skills to analyze climate data. Calculate Measures of Central Tendency (mean, median, mode, range) and Mean Absolute Deviation. Master Box and Whisker Plots, Histograms, Dot Plots, Stem and Leaf Charts. Write StatisticaPrice $31.92Original Price $39.90Save $7.98
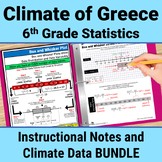 Enrich your study of Ancient Greece using 6th Grade statistics skills to analyze Greek climate data. Master Data Display with Box and Whisker Plots, Histograms, Dot Plots, Stem and Leaf Charts. Calculate Measures of Central Tendency (mean, median, mode, range) and Mean Absolute Deviation. Write StatPrice $13.80Original Price $16.15Save $2.35
Description
Teach all 6th Grade Statistics and Probability Standards with this 10-day Instructional Notes and Practice Unit. Calculate Measures of Central Tendency (mean, median, mode, range) and Mean Absolute Deviation. Master Data Display with Box and Whisker Plots, Histograms, Dot Plots, Stem and Leaf Charts. Write Statistical Questions. Analyze Data Distribution and Data Variability.
No need to dread teaching 6th Grade Statistics because your textbook does a mediocre job of explaining how to calculate and analyze each statistical measure.
Aligns with CCSS.
Step-by-Step Instructional Notes and Activities guide students to:
- Calculate Mean, Median, Mode, Range, and Mean Absolute Deviation
- Construct Stem and Leaf Plots, Box and Whisker Plots, and Dot Plots
- Complete a Frequency Table and Draw a Histogram
- Recognize and Write Statistical Questions
- Describe Data Set Distribution and Variability
- Includes 2 Data Sets for practice along with blank templates for calculation and graphing
- Includes 10-Day Pacing Guide and Answer Keys
- Color and BW
PRINT and GO! Just add colored pencils
FILES provided in PDF and PPT formats. Convert PPT to Google Slides for upload to your password-protected, student-only access Google Classroom
TEACHERS LIKE YOU SAID . . .
⭐⭐⭐⭐⭐ Ashley O. says, "HANDS DOWN my favorite resource currently! I am teaching 6th grade statistics for the first time and these have been so much help for my students (and myself!!) THANK YOU!!"
⭐⭐⭐⭐⭐ Maureen T. says, "It was especially helpful to have kids set up notes without me having to write all the notes down."
⭐⭐⭐⭐⭐ Pamela W. says, "This is a great resource! My students really enjoyed getting to go through this unit."
Check out my PREVIEW for a more detailed look at this resource.
Don’t hesitate to email me with any questions. Middlegradesmath2018@gmail.com
©Mary Jenkins Middle Grades Math. All rights reserved by author. Permission to copy for classroom use by one teacher/classroom only. This product may not be used on online education sites, including, but not limited to, Outschool. Violations are subject to the penalties of the Digital Millennium Copyright Act.
