TPT
Total:
$0.00

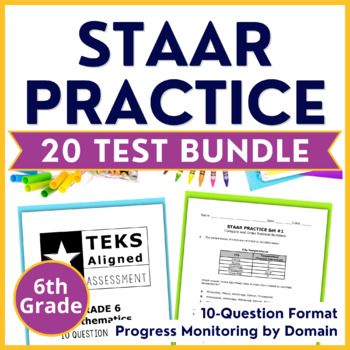
6th Grade Math STAAR Practice Bundle - Progress Monitoring by Domain

Rated 4.86 out of 5, based on 171 reviews
4.9 (171 ratings)
;
Catherine Solanik
2.8k Followers
Grade Levels
6th, Homeschool
Resource Type
Standards
Formats Included
  • Zip
Pages
139 pages
$24.50
List Price:
$35.00
You Save:
$10.50
Bundle
$24.50
List Price:
$35.00
You Save:
$10.50
Bundle
Share this resource
Report this resource to TPT
Catherine Solanik
2.8k Followers

What educators are saying

Excellent review of specific types of questions. The sections were used in small group tutoring with students who struggle with word problems.

Products in this Bundle (10)

    showing 1-5 of 10 products

    Description

    Make sure your students are mastering the standards at a rigorous high-stakes testing level. These TEKS & STAAR Aligned 10-Question Assessments are easy to incorporate as quick checks, review, practice, progress monitoring, guided math, intervention, and STAAR test-prep!

    These STAAR Practice assessments are grouped by related standards/topics allowing for targeted practice. The 10-question format makes test prep, review, and practice much more manageable!

    • This resource is now available for Google Drive! IF YOU WOULD PREFER THE NEW GOOGLE VERSION CLICK HERE. The Google version includes BOTH this Original Print Format + a Self-Grading Google Forms Format!

    ALL SETS INCLUDED

    1. Compare & Order Numbers
    2. Operations
    3. Ratios, Rates, & Proportional Reasoning
    4. Percents
    5. Algebraic Representations
    6. Expressions & Order of Operations
    7. Equations & Inequalities
    8. Geometry & Measurement
    9. Data Analysis
    10. Personal Financial Literacy


    WHAT'S INCLUDED WITH EACH SET

    • 2 assessments per set - 20 different assessments in all
    • PDF printable format - Student Test Booklets
    • Teacher Answer Key Blueprints
    • Student Answer Documents

    FOLLOW ME for New Products, Sales, and Freebies!

    ❤️ I hope this description helps to clarify! If you have any questions or would like to contact me feel free to email me at solanikcurriculum@gmail.com

    Terms of Use

    Copyright © Catherine Solanik. All rights reserved by the author. This product is to be used by the original downloader only. Copying for more than one teacher, classroom, department, school, or school system is prohibited. This product may not be distributed or displayed digitally for public view. Failure to comply is a copyright infringement and a violation of the Digital Millennium Copyright Act (DMCA). Clipart and elements found in this PDF are copyrighted and cannot be extracted and used outside of this file without permission or license. Intended for classroom and personal use only.

    Total Pages
    139 pages
    Answer Key
    Included
    Teaching Duration
    1 Year
    Report this resource to TPT
    Reported resources will be reviewed by our team. Report this resource to let us know if this resource violates TPT’s content guidelines.

    Standards

    to see state-specific standards (only available in the US).
    Find the area of right triangles, other triangles, special quadrilaterals, and polygons by composing into rectangles or decomposing into triangles and other shapes; apply these techniques in the context of solving real-world and mathematical problems.
    Find the volume of a right rectangular prism with fractional edge lengths by packing it with unit cubes of the appropriate unit fraction edge lengths, and show that the volume is the same as would be found by multiplying the edge lengths of the prism. Apply the formulas 𝘝 = 𝘭 𝘸 𝘩 and 𝘝 = 𝘣 𝘩 to find volumes of right rectangular prisms with fractional edge lengths in the context of solving real-world and mathematical problems.
    Recognize a statistical question as one that anticipates variability in the data related to the question and accounts for it in the answers. For example, “How old am I?” is not a statistical question, but “How old are the students in my school?” is a statistical question because one anticipates variability in students’ ages.
    Understand that a set of data collected to answer a statistical question has a distribution which can be described by its center, spread, and overall shape.
    Recognize that a measure of center for a numerical data set summarizes all of its values with a single number, while a measure of variation describes how its values vary with a single number.

    Reviews

    Questions & Answers

    2.8k Followers