TPT
Total:
$0.00

6th Grade Math Guided Notes and Practice

Rated 4.93 out of 5, based on 49 reviews
4.9Β (49 ratings)
;
Divide and Calculate
34 Followers
Grade Levels
5th - 7th
Subjects
Standards
Formats Included
  • PDF
Pages
71 pages
$13.95
$13.95
Share this resource
Report this resource to TPT
Divide and Calculate
34 Followers

Description

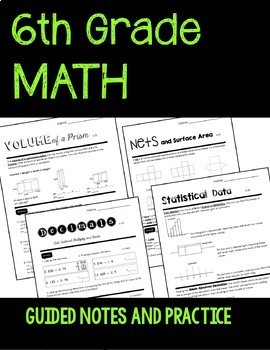
6th Grade Math Guided Notes and Practice, featuring 29 lessons.

Easy to read lessons that emphasize the use of current mathematical practices and strategies.

Great for introducing the concept before your textbook lesson.

Organized by domain, with labels within each lesson to encourage the use of the Standards for Mathematical Practice.

Many possible uses: introductory lesson, weekly homework page, supplement your curriculum, math notebook, extra credit, interactive notebook resource, sub plans, end of the year review.

Each lesson is 2 pages, front/back printable, with math notes and differentiated practice.

Have students keep in their math binder to study throughout the year.

Includes student cover page and answer key.

*Your purchase is for 1 teacher license. This resource may be printed and distributed to your students in your classroom only. Please purchase additional licenses to share with other teachers. Thank you!

Ratios and

Proportional Relationships 6.RP

1. Ratios

2. Equivalent Ratios

3. Ratio Tables, Graphs, and Double Number Lines

4. Ratio Reasoning

5. Percents

6. Benchmark Percents

The Number System 6.NS

1. Dividing Fractions

2. Multi-Digit Division

3. Decimals

4. Greatest Common Factor (GCF)

5. Least Common Multiple (LCM)

6. The Number Line

7. Coordinate Plane

8. Absolute Value

Expressions and Equations 6.EE

1. Expressions

2. Writing Expressions

3. Order of Operations

4. Algebraic Expressions

5. Writing Equations

6. Solving Equations

7. Inequalities

Geometry 6.G

1. Area of a Triangle

2. Area of Polygons

3. Volume of a Prism

4. Nets and Surface Area

Statistics and Probability 6.SP

1. Statistical Questions

2. Measures of Center

3. Dot Plots, Histograms, and Box Plots

4. Statistical Data

Total Pages
71 pages
Answer Key
Included
Teaching Duration
1 Year
Report this resource to TPT
Reported resources will be reviewed by our team. Report this resource to let us know if this resource violates TPT’s content guidelines.

Standards

to see state-specific standards (only available in the US).
Find the area of right triangles, other triangles, special quadrilaterals, and polygons by composing into rectangles or decomposing into triangles and other shapes; apply these techniques in the context of solving real-world and mathematical problems.
Find the volume of a right rectangular prism with fractional edge lengths by packing it with unit cubes of the appropriate unit fraction edge lengths, and show that the volume is the same as would be found by multiplying the edge lengths of the prism. Apply the formulas 𝘝 = 𝘭 𝘸 𝘩 and 𝘝 = 𝘣 𝘩 to find volumes of right rectangular prisms with fractional edge lengths in the context of solving real-world and mathematical problems.
Draw polygons in the coordinate plane given coordinates for the vertices; use coordinates to find the length of a side joining points with the same first coordinate or the same second coordinate. Apply these techniques in the context of solving real-world and mathematical problems.
Represent three-dimensional figures using nets made up of rectangles and triangles, and use the nets to find the surface area of these figures. Apply these techniques in the context of solving real-world and mathematical problems.
Recognize a statistical question as one that anticipates variability in the data related to the question and accounts for it in the answers. For example, β€œHow old am I?” is not a statistical question, but β€œHow old are the students in my school?” is a statistical question because one anticipates variability in students’ ages.

Reviews

Questions & Answers

34 Followers