4.ESS2.1 and 4.ESS1.1 Interactive Anchor Charts - Growing
- PDF
Description
Anchor charts build a culture of literacy in the classroom, as teachers and students make thinking visible by recording content, strategies, processes, cues, and guidelines during the learning process. Posting anchor charts keeps relevant and current learning accessible to students to remind them of prior learning and to enable them to make connections as new learning happens. Students refer to the charts and use them as tools as they answer questions, expand ideas, or contribute to discussions and problem-solving in class.
List of Anchor Charts
List of Anchor Charts
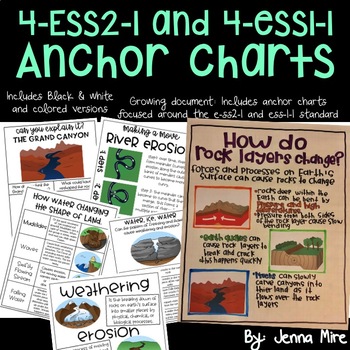
1.A interactive anchor that aligns with the standard 4.EES2-1. Have the students brainstorm ideas and add sticky notes to the chart. Or add sticky notes to the chart as they learn how water shapes Earth’s surface.
2.A interactive circle anchor chart anchor that aligns with the standard 4.EES2-1. Have the students brainstorm ideas and add sticky notes to the chart. Or add sticky notes to the chart as they learn how water shapes Earth’s surface.
3.A interactive chart that ask two questions about how the Grand Canyon was formed. Have the students brainstorm ideas and add sticky notes to the chart. Or add sticky notes to the chart as they learn how water shapes Earth’s surface.
4.Same as #3 but has a colorful picture of the Grand Canyon. A interactive chart that ask two questions about how the Grand Canyon was formed. Have the students brainstorm ideas and add sticky notes to the chart. Or add sticky notes to the chart as they learn how water shapes Earth’s surface.
5.An anchor explaining river erosion and how oxbow lakes form.
6.Same as #5 but has colorful pictures. An anchor explaining river erosion and how oxbow lakes form.
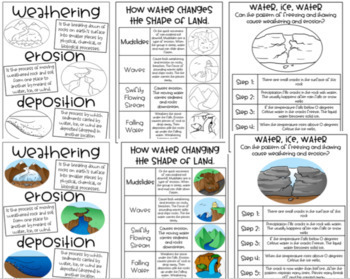
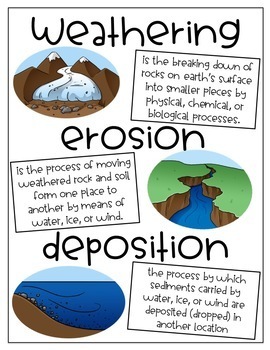
7.An anchor chart explaining weather, erosion, and deposition.
8.Same as #7 but has colorful pictures. An anchor chart explaining weather, erosion, and deposition.
9.An anchor chart with a chart explaining how water changes the shape of the land. Includes pictures and explanations for (mudslides, waves, swiftly flowing streams, and falling water)
10.Same as # 9 but has colorful pictures. An anchor chart with a chart explaining how water changes the shape of the land. Includes pictures and explanations for (mudslides, waves, swiftly flowing streams, and falling water)
11.An anchor chart with a step by step explanation explaining how freezing and thawing causes weathering and erosion.
12.Same as #10 but has colorful pictures. An anchor chart with a step by step explanation explaining how freezing and thawing causes weathering and erosion.
13.An anchor chart with information about glaciers.
14.Same as #13. An anchor chart with information about glaciers
15.A interactive anchor that aligns with the standard 4.EES2-1. Have the students brainstorm ideas and add sticky notes to the chart. Or add sticky notes to the chart as they learn.
16.A interactive circle anchor chart anchor that aligns with the standard 4.EES2-1. Have the students brainstorm ideas and add sticky notes to the chart. Or add sticky notes to the chart as they learn.
17.A interactive chart that ask two questions about how the desert rock formation is formed. Have the students brainstorm ideas and add sticky notes to the chart. Or add sticky notes to the chart as they learn how water shapes Earth’s surface.
18. Same as #17 But in color.
19. A interactive anchor that aligns with the standard 4.EES1-1. Have the students brainstorm ideas and add sticky notes to the chart.
20.A interactive circle anchor chart anchor that aligns with the standard 4.EES1-1. Have the students brainstorm ideas and add sticky notes to the chart.
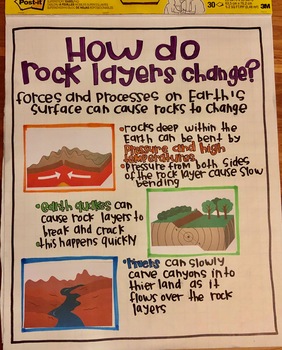
21.How rocks layers change (3 processes) (earth quakes, heat and pressure, and rivers)
22.Same as #20 but in color
How to create the anchor charts:
Step 1:The first thing you will need to do is to hang a piece of chart paper on your SmartBoard’s screen. I like to use the sticky chart paper from Post-it, but any chart paper will work.
Step 2: Projecting! Open up the document in the PDF format. You will need to resize the document so that the edges of the chart paper line up with the document projected. I find the perfect size to type in is 43%.
Step 3: Start tracing. When I am tracing my anchor charts, I like to use Crayola washable markers. To me these are the brightest and the easiest to work with.


