3.MD.3 Interactive Notebook: Bar Graphs and Pictographs⭐ Digital
- PDF
- Google Apps™

Description
Pictographs and Bar Graphs Interactive Math Notebook for 3rd Grade Google Classroom, Paperless:
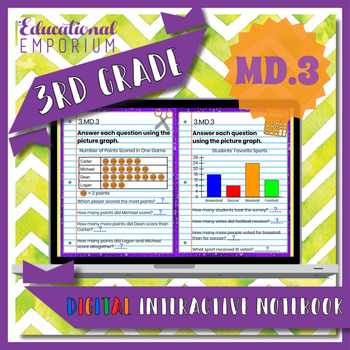
This 3rd grade Google Classroom interactive notebook provides guided instruction, example problems, and quick references aligned with common core standard 3.MD.3: Picture Graphs and Bar Graphs. Now you can get all the interaction and engagement of interactive notebooks without all the mess of cutting and pasting and the hassle of lost papers.
3.MD.3. Draw a scaled picture graph and a scaled bar graph to represent a data set with several categories. Solve one- and two-step "how many more" and "how many less" problems using information presented in scaled bar graphs.
Designed to make the classroom efficient and interactive, these resources are presented as Google Slides, eliminating paper and planning. These digital notebooks are perfect for laptops, iPads, Chromebooks, and tablets of all brands and operating systems!
The product file is a simple PDF with a link to my Google Drive folder where you can copy the resources for your own use.
********************************************************************************************************
Looking for more 3rd Grade Measurement & Domain Interactive Math Notebooks in paperless, Google Classroom format?
All 3rd Grade Math Standards, Digital Interactive Notebook
-3rd Grade Measurement & Data Interactive Notebook Bundle
---3.MD.1 - Telling Time & Elapsed Time
---3.MD.3 - Bar Graphs and Pictographs
---3.MD.4 - Measurement & Line Plots
---3.MD.5 - Area & Unit Squares
---3.MD.6 - Finding Area with Unit Squares
---3.MD.7 - Area: Multiplication, Addition, & Tiling
---3.MD.8 - Perimeter of Polygons
Get the bundle of all 3rd Grade Interactive Notebooks in both Digital and PDF formats for maximum savings!
********************************************************************************************************
Check out my task cards, exit slips, worksheets, quizzes, tests, and more for other grade levels:
In Printable Format:
⭐⭐ Math ULTIMATE Bundle for Grades K-6, PDF Format ⭐⭐
Kindergarten Math ULTIMATE Bundle, PDF Format
1st Grade Math ULTIMATE Bundle, PDF Format
2nd Grade Math ULTIMATE Bundle, PDF Format
3rd Grade Math ULTIMATE Bundle, PDF Format
4th Grade Math ULTIMATE Bundle, PDF Format
5th Grade Math ULTIMATE Bundle, PDF Format
6th Grade Math ULTIMATE Bundle, PDF Format
In Google Classroom Format:
⭐⭐ Math ULTIMATE Bundle for Grades K-6, Google Classroom Format ⭐⭐
Kindergarten Math ULTIMATE Bundle, Google Classroom Format
1st Grade Math ULTIMATE Bundle, Google Classroom Format
2nd Grade Math ULTIMATE Bundle, Google Classroom Format
3rd Grade Math ULTIMATE Bundle, Google Classroom Format
4th Grade Math ULTIMATE Bundle, Google Classroom Format
5th Grade Math ULTIMATE Bundle, Google Classroom Format
6th Grade Math ULTIMATE Bundle, Google Classroom Format
In Printable + Google Classroom Formats:
⭐⭐ Math ULTIMATE Bundle for Grades K-6, PDF + Google Classroom Formats ⭐⭐
Kindergarten Math ULTIMATE Bundle, PDF + Google Classroom Formats
1st Grade Math ULTIMATE Bundle, PDF + Google Classroom Formats
2nd Grade Math ULTIMATE Bundle, PDF + Google Classroom Formats
3rd Grade Math ULTIMATE Bundle, PDF + Google Classroom Formats
4th Grade Math ULTIMATE Bundle, PDF + Google Classroom Formats
5th Grade Math ULTIMATE Bundle, PDF + Google Classroom Formats
6th Grade Math ULTIMATE Bundle, PDF + Google Classroom Formats


