2023-2024 Graphing Template
- Google Sheets™
- Excel Spreadsheets

Description
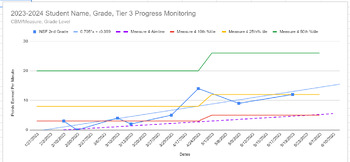
This graphing template allows easy tracking of student data within Google Sheets. This template allows for simple inputting of dates and progress monitoring scores for easy student trend analysis. It also allows for increases of complexity and specificity by options to add proficiency levels (fall, winter, spring), expected growth aim-line, and calculate student specific trend lines (using slope-ordinary least squares regression) for quick comparisons to weekly rates of improvement. Each template allows for a student to have up to seven measures analyzed on separate graphs. This template is a school psychologist's, MTSS/RTI coordinator's, and data savvy teacher's dream. Finally, a user friendly graphing tool so that we always have graphical proof about our student's response to instruction/intervention. The graphing template comes with a step by step guidance document so even the novice graphers can feel confident.


