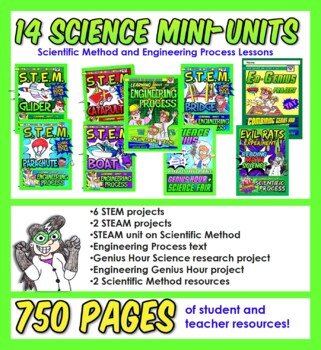
14 activity/unit MEGA SCIENCE Bundle! Gr 3-4
TeachHeath
2.2k Followers
Grade Levels
3rd - 4th
Subjects
Resource Type
Standards
CCSS3.MD.B.3
CCSS3.MD.B.4
CCSS3.MD.D.8
CCSS3.NBT.A.2
CCSS3.NBT.A.3
Formats Included
- Zip
Pages
750 pages
TeachHeath
2.2k Followers
Products in this Bundle (12)
showing 1-5 of 12 products
Bonus
Engineering Process Ppt and posters
Description
Science with a COMIC BOOK TWIST!
Teach kids about ENGINEERING PROCESS and the SCIENTIFIC METHOD.
This packet has over 100 hours of Science fun! Integrated with Math and Reading/Writing, these projects and activities are full of engaging lessons. Great for home learning, Science stations, whole group learning and more.
Over 750 pages of resources are included!
Skills/Topics include:
- Engineering
- Scientific Method
- Reading and research
- Reading and vocablulary
- Writing nonfiction
- Writing fiction
- Math: computation
- Math: data recording and analyzing
- Math: word problems
- Math: operations
- 6 STEM projects (with vocab guides, puzzles, rubrics, and more)
- 2 STEAM projects that teach Scientific Method
- STEAM unit on RATS - comic book style way to learn about Scientific Method
- Engineering text with comprehension questions
- Genius Hour Science research project
- Engineering Genius Hour research project
- 2 Scientific Method resources
Total Pages
750 pages
Answer Key
Included
Teaching Duration
1 Year
Report this resource to TPT
Reported resources will be reviewed by our team. Report this resource to let us know if this resource violates TPT’s content guidelines.
Standards
to see state-specific standards (only available in the US).
CCSS3.MD.B.3
Draw a scaled picture graph and a scaled bar graph to represent a data set with several categories. Solve one- and two-step “how many more” and “how many less” problems using information presented in scaled bar graphs. For example, draw a bar graph in which each square in the bar graph might represent 5 pets.
CCSS3.MD.B.4
Generate measurement data by measuring lengths using rulers marked with halves and fourths of an inch. Show the data by making a line plot, where the horizontal scale is marked off in appropriate units-whole numbers, halves, or quarters.
CCSS3.MD.D.8
Solve real world and mathematical problems involving perimeters of polygons, including finding the perimeter given the side lengths, finding an unknown side length, and exhibiting rectangles with the same perimeter and different areas or with the same area and different perimeters.
CCSS3.NBT.A.2
Fluently add and subtract within 1000 using strategies and algorithms based on place value, properties of operations, and/or the relationship between addition and subtraction.
CCSS3.NBT.A.3
Multiply one-digit whole numbers by multiples of 10 in the range 10–90 (e.g., 9 × 80, 5 × 60) using strategies based on place value and properties of operations.


